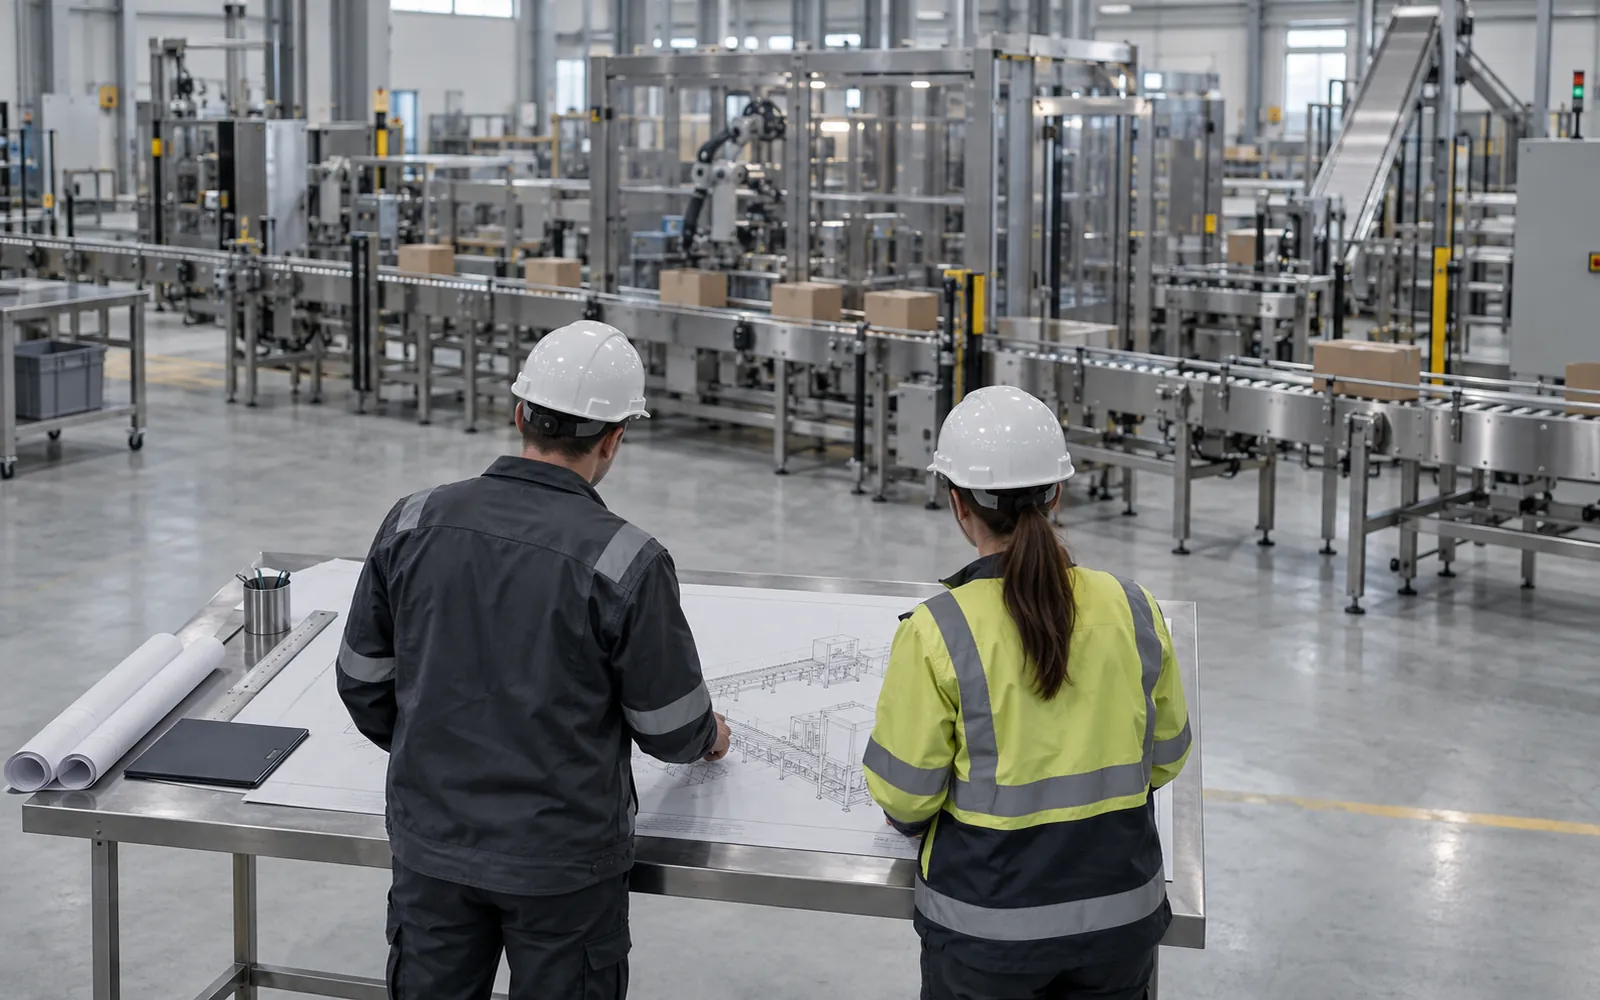
Counting changeover losses twice can inflate the required machine rating. Convert good-output demand using one declared planned-production window and A/P/Q assumptions, then check the hardest SKU, buffers and recovery speeds. The inputs below feed the worked example; they are hypothetical, not a plant benchmark.
| Input | Assumed value / source | Use |
|---|---|---|
| Good output | 10,000 cases/day | Required finished count |
| Schedule | One 480-minute shift | Time boundary |
| Nonproduction time | 30-minute break, no production intended | Exclude once: 450 planned minutes |
| Availability (A) | 80%; includes changeover, cleaning and other stops in that window | Run time / planned time |
| Performance (P) | 90% | Actual running output / ideal running output |
| Quality (Q) | 98% | Good count / total count |
| Hardest SKU | Case format requiring the slowest verified cycle | Confirm rate with this format |
| Required sustained good rate | 10,000 / 450 = 22.22 cases/min | Delivered average over planned time |
Integration ownership, turnkey scope and layout are related decisions.
The design process in order
Line engineering follows a sequence, and skipping a step usually means coming back to it later at higher cost.
- Define products, packages, and constraints.
- Convert volume into required rates.
- Set a design rate that allows for real operation.
- Select machines and give each a role in the speed profile.
- Design buffers and accumulation.
- Plan changeovers.
- Size utilities and services.
- Design for operators and maintainers.
- Develop the layout.
- Define interfaces, controls, and acceptance tests.
Start with requirements
Write the requirements before any machine is chosen. They should say what products the line will run, in what package formats, sizes, and weights, and which case is the hardest. They should also say what the plant has to work with: floor area, ceiling height, available utilities, temperature, cleaning method, and any food, beverage, or pharmaceutical rules that apply.
Do not write them only for today. Ask which formats are likely in the next few years, whether volume will grow, and whether the line will be expanded. Spare capacity and room to expand cost less before the line is built than after.
Engineers also need business information they rarely receive: the shifts the line will run, whether it will run unattended at times, how much changeover downtime the plant tolerates, and whether the line feeds a shipping deadline that makes a stoppage especially costly.
Separate must-haves from preferences. A format that must run on day one is a requirement. A format the marketing team might launch next year is a preference, and a reason to leave room, not a reason to design for it today.
From requirements to rates
Keep demand, ideal running rate and sustained good-output rate separate. Vorne’s public OEE method uses OEE = A × P × Q, with A = run time / planned production time, P covering slow cycles and small stops, and Q = good count / total count. See its calculation method and time/loss definitions, accessed October 8, 2026.
One time basis, losses counted once
- Start with required good output and the scheduled period.
- Exclude only time with no intention to produce to get planned production time.
- Keep changeover and cleaning inside that window when the chosen OEE includes them as Availability losses. Do not subtract them again before dividing by OEE. Document any differently defined window and recompute its factors.
- Required ideal running capacity = good-output demand / (planned minutes × A × P × Q). Nonpositive time or factors do not produce a usable capacity estimate.
Worked calculation — assumed inputs
Using the opening table: planned production time = 480 - 30 = 450 minutes. Assume 30 minutes of changeover, 20 of cleaning and 40 of other stops within that window: total stop time 90 minutes and run time 360 minutes, so A = 360 / 450 = 0.80. With P = 0.90 and Q = 0.98, OEE = 0.7056.
Required ideal running capacity = 10,000 / (450 × 0.7056) = 31.49 cases/min. An assumed candidate demonstrated at 32 cases/min on the hardest SKU gives 32 × 450 × 0.7056 = 10,160.64 good cases/day in this model. The sustained good-output rate is 32 × 0.7056 = 22.58 cases/min, not 32.
These fractions are design assumptions, not guaranteed output. Validate them and the sustained candidate rate during acceptance. The palletizer selection guide explains how to compare supplier rates on a common basis.
Machine selection
Machine selection comes after rates, because the rates define what each machine must do. It means choosing a technology and a size for each step, then checking that the chosen set works together. For each machine, check these:
- Rated speed on your package. Ask for the rate on your hardest format, not a catalog maximum.
- Format flexibility: how many formats the machine handles, and what a change involves.
- Sensitivity to package variation. Damp, bulged, or warped packages can stop a machine that runs perfectly on clean samples.
- Fit with its neighbors. Infeed and discharge heights, orientation, grouping, and spacing should match the adjacent machines or be easy to adapt.
- Controls and data. Does the machine expose the signals and states the line design needs? A common machine state model, such as PackML (ISA-TR88.00.02), can simplify a line with machines from several suppliers.
- Service and spare parts access. A machine that is hard to clean or maintain costs more than its price suggests.
At the end of the line, the choices include the type of case packer, the way cases are conveyed, and whether to palletize with a layer machine or a robot. The pages on case packers, conventional palletizers, and robotic palletizers cover those choices, and the robotic versus conventional palletizer guide compares them.
The V-curve and the bottleneck
The V-curve is the best-known way to describe machine speeds around a bottleneck. Line designers and controls and software vendors all use it, and published explanations describe it consistently. It is worth understanding for what it does and for its limits.
The idea
On a line with accumulation between machines, one machine or group of machines is the slowest. It is called the critical machine, the core machine, or the bottleneck, and it is commonly the filler or whichever machine is slowest and most expensive. Working back from the critical machine, each upstream machine is given a little more capacity than the one after it. Working forward, each downstream machine is given a little more capacity than the one before it. Plot capacity against position on the line and the shape is a V, with the critical machine at the bottom.
Why the V is useful
When a machine somewhere stops, product backs up behind it or the machines after it run short. The critical machine is protected from both if the buffers around it have product available and room to receive it. That only works if the neighboring machines have spare capacity. After a stop they run faster than the critical machine, which refills a drained buffer or clears one that piled up. Line throughput depends on how much of the time the critical machine runs at its rated speed, so the aim of the V is to keep the slowest machine running while the faster machines deal with the interruptions.
The steepness of the V matters. A steeper V recovers faster from a stop, but it also pushes neighboring machines further from their normal speed and demands more from the buffers. The slope and buffer sizes should be set from how often and how long each machine tends to stop. A line whose upstream machines rarely stop needs less spare capacity than one with a troublesome machine.
The limits
Practitioners criticize the V-curve in two main ways. First, only the bottleneck runs at a steady speed. Every other machine is constantly slowing, speeding up, starving, or backing up, which can mean more minor stops and more wear. Second, a simple V-curve ignores the interactions between each machine and each accumulation zone. The sources linked on this page argue that steady-state speeds, surge speeds, and ramp times for every machine should all be design inputs, and that a V-curve is sometimes used as cover for speed settings based on opinion or on the last line a vendor built.
Treat the V-curve as a first sketch and a vocabulary, not a verdict. After the sketch, check the design with a calculation or a simulation of the worst plausible sequence of stops. Look at what happens when the critical machine stops, when its neighbors stop, and when two machines stop at once.
Practical points
- Identify the critical machine first. If two machines are close in capacity, the line can behave as if it had two bottlenecks.
- Give the machines on either side a modest speed margin that matches how often they stop, not a fixed percentage chosen for convenience.
- The critical machine can change when the product changes. A format that is slow at the filler may be slow at the case packer instead.
- Document each machine’s normal and surge speeds, so the plant can later understand why the line behaves as it does.
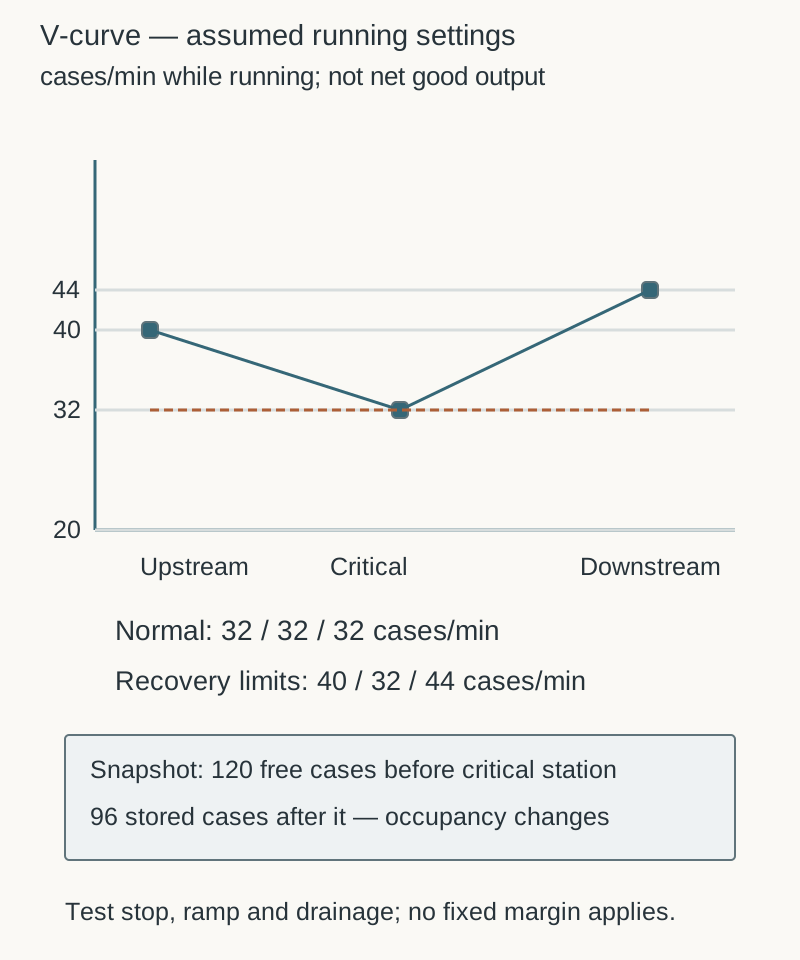
Recovery check record
The curve illustrates the same assumed 32 cases/min candidate above. Normal settings are 32 cases/min at all three stations; assumed recovery limits are 40 upstream and 44 downstream. The example records 120 free case positions before the critical machine and 96 stored cases after it at one instant. Those states change during a stop; they are not required buffer sizes.
| Stop / restart check | Record for the tested SKU |
|---|---|
| Initial buffer state | Usable capacity ___; occupied ___; free ___ cases |
| During the stop | Upstream rate ___; downstream rate ___ cases/min; duration ___ min |
| Restart | Authorized sequence ___; actual ramp time ___; achieved rates ___ |
| Recovery | Net buffer inflow/outflow ___ cases/min; time to target occupancy ___ |
| Outcome | Starved/blocked stations ___; good output ___; evidence file ___; owner ___ |
Common mistake: copying a percentage margin without testing drainage. At assumed downstream 44 and continuing arrivals 32 cases/min, a 96-case backlog drains in 96 / (44 - 32) = 8 minutes, excluding ramp time and further stops. Equal rates cannot drain it while arrivals continue.
Accumulation and buffers
Accumulation is the buffer between machines. Without it, a stop at one machine stops its neighbors immediately. With enough of it, a short stop is invisible to the rest of the line.
What accumulation does
A buffer holds the product that keeps arriving from upstream when a downstream machine stops. When an upstream machine stops, it holds the product that keeps the downstream machine fed. Which job matters more depends on which machine is critical. Buffers on both sides of the bottleneck protect it, and the bottleneck should rarely wait.
How to size it
Size accumulation from stop behavior, not from a rule of thumb. For each machine, estimate how often it stops and how long it takes to recover. Then, for each buffer, ask how long the neighbors must keep running through a typical stop, and how fast the buffer refills afterward. A buffer that is too small turns a short stop into a line stop. One that is too large wastes floor area, holds more product that can be damaged, and can mask problems that should be fixed.
Hardware options
The right hardware depends on the package. Containers that must queue without touching call for accumulating tabletop or roller zones. Cases may use zero-pressure roller zones. Some products suit rotary or spiral buffers. The accumulation conveyors page covers the mechanisms. The bottle conveyors and case conveyors pages cover how transfers and guiding affect flow. The conveyor cost guide lists what drives cost, including buffer length.
Buffer control rules
The controls have to manage the buffer, not just allow it. They decide when a machine slows down because a buffer is nearly full, when it speeds up because one is nearly empty, and when it stops. These rules are the line’s control philosophy. Write them down and test them rather than leaving them to the program’s defaults.
Changeover strategy
Changeover is the time and effort to switch a line from one product or format to another. In plants with many formats it has an outsized effect on net rate, so plan for it from the start of line design, not after the machines are chosen.
Types of change
A product change within the same format is often only a recipe or label change, sometimes with no mechanical work. A format change means adjusting guides, tooling, and settings for a different container or case size. A cleaning change is required between allergens or products where cross-contamination matters. A pallet pattern change is often a software change on a robot, or a mechanical change on a layer machine.
Design choices that shape changeover
- Every format added is a setting to maintain and a change to perform, so consider whether formats could be consolidated.
- Machines with indicated, repeatable settings and fewer tools reduce changeover time and variation between operators.
- Storing settings in the control system lets a format change be a selection instead of a manual adjustment.
- One operator command, or a clear sequence, that makes all machines change in the right order saves the time spent waiting for each machine.
- Planning how the line empties before a change and how it restarts afterward can save a surprising amount of time.
- Machines that can be changed while others are still finishing save time over those that need the whole line to stop.
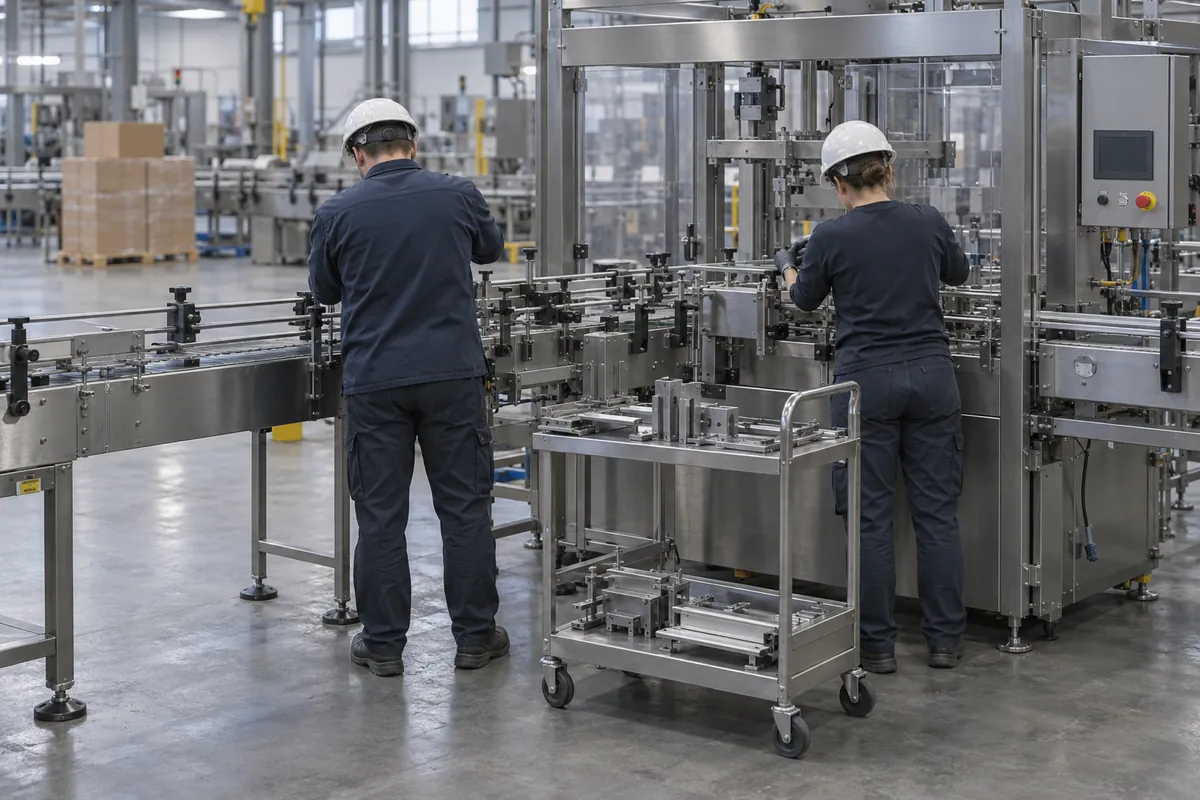
Set a target for each type of change, assign an owner for each task, and test the change during acceptance. A line accepted without a changeover test has not been tested on a major part of real operation. The commissioning and acceptance checklist lists changeover among the items a factory acceptance protocol should include.
Utilities and services
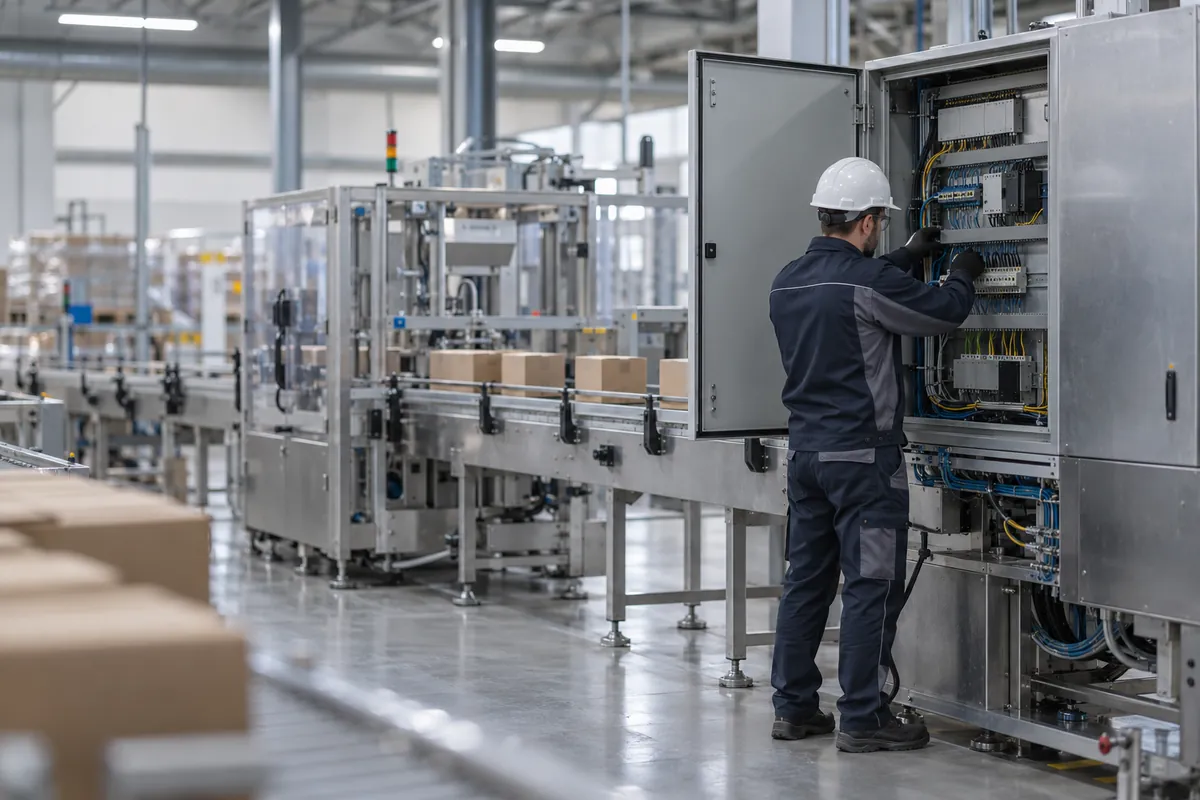
Utilities are easy to leave until late, yet they affect the building, the schedule, and the cost. State what each machine needs and what the plant can provide, then compare the two.
- Electrical power: total connected load, peak demand, voltage and phase, and supply quality. Consider startup surges and what happens during a power dip.
- Compressed air: volume, pressure, and quality. Many packaging machines use air for actuators and vacuum, and consumption is easy to underestimate when several machines run together.
- Water and drainage for cleaning, cooling, or process needs. Washdown areas need drainage designed for the volume.
- Chilled water or heating where a process needs it, and a stable ambient temperature for machines that require one.
- Vacuum and extraction for machines that handle bags, film, or dust.
- Network and data: cabling, switches, and access to plant systems and remote support.
- Consumables such as film, labels, glue, tape, cases, and pallets, with the storage and handling space they need.
Size utilities for peak demand, not average, and allow for all machines restarting at once after a stop. Keep a clear boundary between what the line supplier provides and what the plant provides where utilities connect. Routing utilities through the building is a layout topic and appears on the layout page.
Human factors
People will run, clean, adjust, and repair the line. Designing for them improves safety and output, and it is usually cheaper to do early.
Start with workload: how many people the line needs at its rated speed and what each one does. Loading film, reloading cases, and clearing jams should be reachable without unusual postures. Operators should be able to see the machines they are responsible for, and alarms should say what is wrong and what to do. Machines with different screen layouts and alarm styles slow troubleshooting, so common state models and alarm conventions help.
Ergonomics covers reach, lifting, and repetitive movement. Heavy change parts should be light enough to handle or supported by lifting aids. Guarding must allow access for routine tasks without encouraging bypass, because poorly placed gates and slow restarts lead people to find shortcuts. Panels, filters, lubrication points, and sensors should be reachable without dismantling neighboring equipment.
Train operators and maintainers on the line as a system, with the real alarm behavior and recovery routines, not only on each machine. Better still, involve them during design. They know where jams happen on the current line and which tasks they dislike, and their views are among the cheapest and most useful inputs available.
Layout: a short pointer
Layout turns the design into a plan of the floor. It decides line shape, material and people flow, clearances, forklift paths, and safety zones. Those decisions have their own methods, so this page does not repeat them. Read the packaging line layout page for the details, and the packaging line layout guide for a decision-oriented summary. Line design feeds layout with the list of machines, their sizes, buffer lengths, utility needs, and access requirements.
Controls, interfaces, and acceptance
The last design step is to make the interfaces and tests explicit. The interface list names every boundary and who owns it. The control philosophy says how buffers, speeds, and stops are managed. The acceptance plan states how the net rate, the changeover times, and the safety functions will be proved, first in a factory test and then on site. The packaging line integration hub covers these topics, and the turnkey packaging line page covers them from a contract standpoint.
For an upstream carton-filling expansion, use the SIG Neo downstream integration review to check rate units, stop ownership and complete-line changeover boundaries.
Common design mistakes
- Designing from machine ratings instead of net rate. The line will not run at its slowest machine’s rating.
- Copying a V-curve without checking it. A speed profile not tested against stop behavior can be wrong in either direction.
- Treating accumulation as a fixed length. Buffer length should follow from stops and recovery.
- Ignoring changeovers. A line with many formats can lose more time to change than to breakdowns.
- Leaving utilities until installation. Late discovery of a shortfall in air or power hits the schedule.
- Designing around the ideal operator. Shift staff must be able to use the line on a bad day.
- Skipping acceptance tests on the hardest case. Prove the line on the format that stresses it most.
Checklist
- Written requirements, including the hardest format and expected growth
- Required net rate for the hardest product, with the OEE assumption and its source
- Critical machine identified, with speed margins for its neighbors
- Buffer sizes derived from stop behavior, and a control philosophy for them
- Changeover targets for each type of change and a test plan
- Utility loads for each machine and the plant’s limits
- Operator tasks, access, and training plan
- Interface list, controls approach, and acceptance protocol drafts
- Layout work started with the machine list, buffer lengths, and utility needs as inputs
For industry context, see how line design questions play out in beverage packaging and food packaging.